
We have referred to the audit parallelogram a few times in this blog as Middlegame has devoted a lot of focus on assortment, pricing and merchandising for emerging markets. I thought it would eventually be a good idea to explain the audit parallelogram concept in a little more detail, but I got beat to the punch: Last month, a client directly asked for an explanation. Below is a summary of that write-up:
A retail tracking service measures the sales movement of products along with some of the reasons why their sales behave the way they do. This tracking is done through a couple of methodologies. The most prevalent to most readers is the use of scanner data that IRI pioneered in the late ’80s. Before that, warehouse withdraws were recorded and organized. This was made popular by SAMI, but was quickly overtaken by the scanner data by the early ’90s. However, before any of this were the retail audits that Art Nielsen introduced nearly a century ago, which gave us the term “bean counters.”Although technology has greatly enhanced data collection for the retail audit, the core methodology remains consistent and extremely useful in emerging markets.
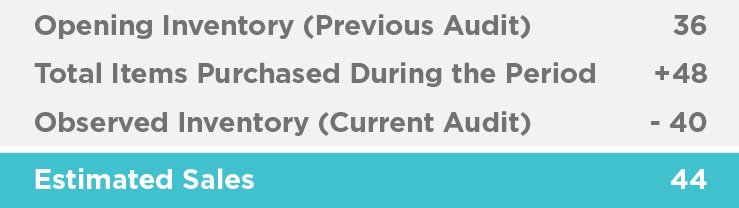
The key differences between the audit and scanning are the frequency and granularity of information reported as well as the method of estimating sales for the time period. In the retail audit, an estimate of consumer sales is obtained by measuring the change in inventory plus the purchase records of each SKU in each sample store:
Therefore, the estimation of sales is highly dependent on those bean counters getting the inventory right. The only issue is that it is impractical to manually audit all stores on the last day of the audit period to align the inventory counts. A span of time exists over which the audit work is conducted across sample stores and the audit period described as NOV/DEC18 in a retail audit is not the same as the last 61 days (roughly nine weeks) of 2018 for a scanner-based retail tracking service.
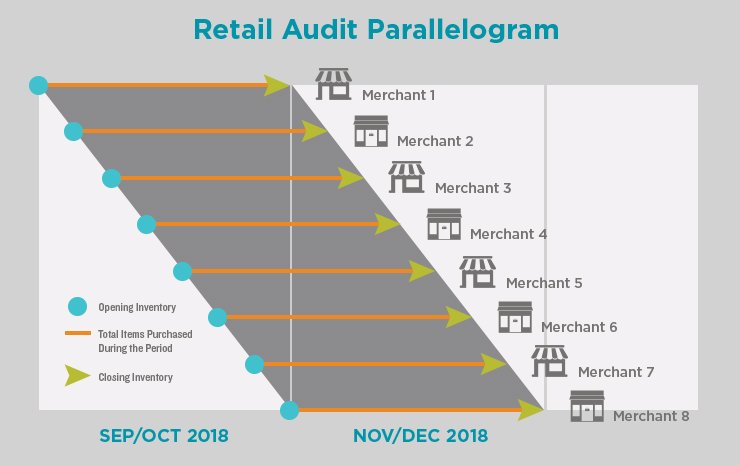
This introduces the retail cycle in the form of the “parallelogram” depicted below. The first store audited at the beginning of NOV/DEC18 reflects mostly sales from SEP/OCT18, while the last store audited is the only one that reflects sales confined to in NOV/DEC18. All the sample stores in between these are a sliding mix of SEP/OCT18 and NOV/DEC18. Unlike with a scanner-based retail tracking service, the time periods are not precise. This is a big watch-out that many marketing mix modelling suppliers ignore when they align sales and marketing activities. They simply don’t understand the actual data.
While bean counters are in the store counting inventory, other information about each item is recorded that adds considerable value. Typically, information includes the observed price, distribution by location and the ability to determine out-of-stock conditions. These are specific to the day of the audit. Nielsen in no way suggests that the price for a SKU was static over the period or that the item was out-of-stock for the entire period in a store. Sadly, clients and other suppliers simply take their scanner-based perspective and apply it to the audit data, which can cause problems. However, since the physical store visits are conducted over the entire period represented by the audit, these measures reflect a good estimate of the average conditions in the market for the period. A price of ¥325 and an out-of-stock rate of 6 percent mean that the average consumer purchase situation would have seen a price of approximately ¥325 and had a 6 percent chance of finding the product out of stock on the day he or she shopped. It works perfectly for the cross-sectional view that Middlegame takes with the CIA®platform.
I hope this is a good enough summary to communicate the main point. Scanner data and retail audit data are not the same and cannot be treated the same way from an analytics standpoint. It is a problem that we see repeatedly where clients have worked with other suppliers and gotten lackluster results. In a way, it has poisoned the well for many organizations that are becoming ever more dependent on emerging markets. We make a point of explicitly understanding the exact data collection techniques and therefore exactly what the data represents at Middlegame. If nothing else, hopefully we can help you with that alone.
Middlegame is the only ROMI consultancy of its kind that offers a holistic view of the implications of resource allocation and investment in the marketplace. Our approach to scenario-planning differs from other marketing analytics providers by addressing the anticipated outcome for every SKU (your portfolio and your competitors’) in every channel. Similar to the pieces in chess, each stakeholder can now evaluate the trade-offs of potential choices and collectively apply them to create win-win results.